Forest Health Monitoring Protocols
The methods below represent the 'index approach' to determining the health of forests by measuring the most pertinent components of a very complex ecological system. They were designed to be rapid, inexpensive and scientifically rigorous protocols that can be easily implemented by natural resource staff and volunteers.
Method Name: Sentinel Seedlings
Concept: An experimental approach to measure the effectiveness of deer management programs and investigate potential for natural regeneration of trees and shrubs. The method involves planting red oak seedlings within upland forest habitat and measuring the percentage of browsed individuals after seven months. [Note: Red oak is ubiquitous in upland forests of New Jersey. Green ash is utilized in wetland forest habitats.]
Rationale: Experimental planting is a simple technique to determine current deer browse intensity that reduces 'ecological noise' involved with measuring browse impacts on existing woody plants. Factors that are controlled and/or accounted for within the methodology include: 1) difficulty in locating a statistically valid quantity of naturally occurring woody seedlings (e.g., little or no existing natural woody vegetation below the browse line), 2) lack of natural regeneration following initiation of deer management programs caused by other factors (e.g., recovery lag time caused by various factors such as temporally low seed production, drought conditions that kill seedlings, or continuing impacts of low deer densities when little browse is available), 3) previous browse damage that complicates interpretation of browse levels in the time period of interest (e.g., ambiguity in separating new browse from old browse), and 4) clumped or sparse distribution of natural seedlings (e.g., adequate sampling of an entire area of interest is not possible).
Methods:
Materials -
- Red Oak seedlings (minimum of 12" tall) - 10 per plot x ____ plots = ____ seedlings. [Note: Bare root seedlings are available from the New Jersey Forest Tree Nursery in Jackson, New Jersey. They are usually shipped in spring but can be picked up in late-November with their permission. Seedlings are sold in packs of 100. Prices are $38/pack (1-4 packs), $30/pack (5-24 packs), and $20/pack (25-75 packs). Seedlings are also available from private nurseries.
- Meter stick
- Flagging Tape (enough to mark mature trees surrounding each plot and to mark each seedling)
- Pin Flags (enough to mark the four corners of each plot)
- Seedling planting spade / tree bar
- Compass (to determine north-south orientation of each plot)
- GPS Unit (to determine the location of each plot)
- Data sheets (available upon request)
Procedures -
Timing - Seedlings should be planted while dormant in late autumn (mid-November through mid-December). The recording of browse should be performed seven months after planting (mid-June through mid-July). [Note: This timing reduces the possibility of seedling death (and therefore lack of palatability) due to growing season events such as drought, insect herbivory, pathogen attack, etc.
Measurements should be repeated every 2-4 years after collecting baseline data.
Sample Size - In past studies, I have calculated the total number of plots required by dividing the entire area of interest by 25 (i.e., 1 plot for each 25 acres). This number can be reduced if sampling of large areas is required. Conversely, if the area of interest is small, than plot density can be increased. [Note: Sample sizes of less than 10 plots have reduced statistical validity].
Plot Placement Rules - To remove edge effects when testing forest areas, plots should be at least 25 meters from non-forest habitat (structures/disturbances including homes, roads, open fields, etc.). Unless specifically part of the experimental design, plots should not be located in forested wetlands or larger canopy gaps (i.e., canopy coverage less than 30% over an area greater than ¼ acre). Other areas that should be avoided include rock outcrops/areas too rocky to plant seedlings, early successional forest types (e.g., stem exclusion/pole phase, successional/dense red cedar woodlands. If a pre-selected plot location (see below) does not meet the above criteria, then a new point should be randomly selected. [Note: Do not non-randomly shift the plot location to a more suitable nearby area away from the original grid point.]
Plot Location Selection - Each plot location should be chosen randomly on the established statewide 100 meter x 100 meter grid (GIS shapefile available upon request). Random selection is achieved by systematic assignment of identification numbers to each grid point within the area of interest. Generally, one would 'clip' the statewide grid to the shape of the area of interest before assigning grid identification numbers (this is a simple operation within ArcMap). Plot selection is achieved by using a random numbers table or similar resources (see www.random.org) to select the number of plots desired from the full number of possible plots within the area of interest. [Note: If desired, sample plots can be 'stratified' by sub-areas within the entire area of interest. This would be beneficial wherever there is a special interest in assuring measurements at various locations (e.g., two distinct habitat types, areas near and distant to parking access, etc.).] [Note: The spacing of plot locations on the grid maintains independence of plots (i.e., two plots cannot be simultaneously considered during a single browse event). The 100 meter spacing also aides sample placement across the landscape and avoids potential placement bias (e.g., plot locations in known areas of high or low deer activity).]
Seedling Plot Design - Plant 10 seedlings in two parallel rows of 5 with 1 meter between adjacent seedlings. The long edge of plots should face North-South, flagging tape should be placed in several trees surrounding the plot, pin flags should be placed in the four plot corners, and flagging tape should be tied to the base of each seedling to assist with their relocation.
Browse Data Collection - Immediately upon planting seedlings within a plot, the number of intact end bud clusters should be counted on each seedling (end buds in oak species generally consist of a cluster of three or more buds at the terminus of a stem). [Note: Branches may break in the process of transporting and planting seedlings. An initial end bud cluster count allows clear interpretation of browse at the end of the experiment. Seedlings without end bud clusters should not be used in the experiment.] Final end bud cluster counts are performed after seven months of exposure to deer browse. [Note: Although browse in forest habitat is usually associated with deer, a variety of other animals may browse woody seedlings. However, removal by deer is associated with a noticeably jagged/torn stem. Removal by rabbits and rodents are associated with a clean, angled stem cut (approximately 45 ).]
Data Analysis - The proportion of seedlings receiving browse can be analyzed using Goodness-of-Fit statistics. Results can be compared against a pre-determined benchmark or pre- and post-implementation of a deer management program. If this methodology is used in multiple locations, then results can be compared with each other to statistically determine differences in deer browse between locations based upon a variety of potential factors (e.g., habitat types, deer management strategies, etc.). In addition, a simple review of the spatial pattern of browse should be performed. This can be accomplished by visual assessment of an aerial map depicting plot locations that are labeled with their respective percentages of seedlings browsed. [Note: Previous implementation of this protocol has shown that seedling browse is related to deer density (site 1: 90 deer per square mile = 50% browsed, site 2: 20 deer per square mile = 15% browsed). Neither of these sites had significant natural regeneration, which suggests that experimentally measured browse of 15% is not conducive to regeneration of trees and shrubs. At this time, I can only suggest that measured browse should be below 15%. To provide some guidance, I would assume that experimental seedling browse levels less than 5% would be related to improving advance regeneration and overall forest health.]
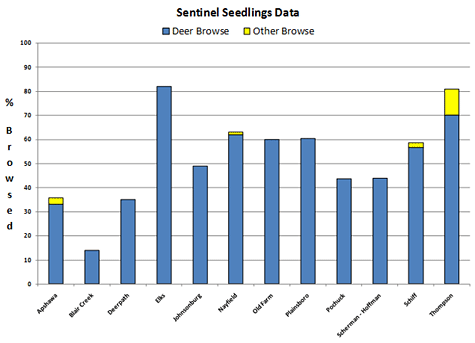
Figure 1. Sentinel Seedling data collected through 2007. Data from ten additional sites will be added in 2008. Sites are located throughout northern New Jersey.

Method Name: Forest Secchi
Concept: A measurement of existing shrub and sapling cover in forest habitat. The method involves measuring the number of grid cells on a white board that are partially or completely obstructed when viewed at 10 meters from a pre-determined point.
Rationale: This method is a very rapid assessment of existing forest conditions and acts as an index of forest health. It is meant to complement the Sentinel Seedling study above that provides 'instantaneous measurements'. Interpretation of this method is unambiguous and can be used to determine the success of a mature deer management program (but baseline data should be taken prior to initiation of a deer management program). Although this method is slower to show the benefits of a deer management program (see Sentinel Seedling rationale above), it directly measures a natural response of the forest to reduced deer densities. The cover of native and non-native species should be collected separately as many non-native invasive species are much less prone to deer browse.
Methods:
Materials -
- One meter square white foam board (capable of being folded in half to facilitate movements through forest habitat)
- Black tape (placed every 0.25m to create an evenly-spaced, 16-cell grid on the white board)
- Densiometer
- 'Guide Post' - 1.4 meters tall
- Plot locations repeated from Sentinel Seedlings above (materials included flagging tape, compass, GPS unit, measuring tape)
- Data Sheets (available upon request)
Procedures -
Forest Secchi measurements should be conducted at the same locations used for the Sentinel Seedling experiment. Measurements should be repeated every 2-4 years after collecting baseline data.
Timing - Sampling of existing woody vegetation can occur at any time during the growing season. To minimize data collection time when using the Sentinel Seedling protocol, measurements should be performed in mid-June through mid-July. [Note: In past experience, the most time consuming part of both techniques is travel time between plots whereas data collection time for both techniques is minimal.]
Sample Size - See Sentinel Seedling above.
Plot Placement Rules - See Sentinel Seedling above.
Plot Location Selection - See Sentinel Seedling above. The same plots used in the Sentinel Seedling study should be used for the Forest Secchi measurements.
Data Collection - A 1 square meter white foam board should be evenly divided into a 16-cell grid using black tape. The number of obstructed cells (partially or completely) should be recorded at a distance of 10 meters from the center point of the plot. Cover of native and non-native species should be recorded separately. For each point, four readings should be taken at the following compass bearings: NE, SE, SW, NW (readings should not be taken directly N-S so that any impacts on vegetation coincident with seedling planting does not significantly alter measurements). The white board should be held 0.4 meters (1.31 feet) above the ground (top of board will then be 1.4 meters or 4.59 feet above ground). [Note: In past experience, deer begin to 'notice' woody vegetation greater than six inches tall. Therefore, sites with a history of high deer densities tend to have very low cover of woody plants taller than the lowest height of the board (i.e., 0.4 meters). The maximum typical height of deer browse damage does not exceed 1.4 meters.] [Note: The construction of a PVC post with Velcro strips located at 0.4 and 1.4 meters increases the speed and accuracy of measurements (The white board should have corresponding Velcro strips located at the center of its base and apex). This technique increases the speed and accuracy of the procedure.]
Ideally, a densiometer should be used to measure forest canopy coverage at each sampling point because shrub and tree sapling density can be impacted by shade (i.e., growth rates are lower under dense canopy coverage). If resources are limiting, canopy coverage should be recorded using a visual estimate and placed into broad categories for rapid data collection (i.e., 0-25, 25-50, 50-75, and 75-100). [Note: If time permits, additional data collection could include a list of woody species within plots along with canopy and herbaceous species composition. Though not essential to data interpretation, this additional data could provide valuable information toward understanding the complexities of forest recovery upon implementation of an effective deer management program.]
Data Analysis - See Sentinel Seedling above. Additional analyses could include comparisons of native and non-native cover related to current browse measured via the Sentinel Seedlings. It is estimated that a healthy forest will have approximately 70% mean woody cover. Ideally, future data collection will involve reference sites that are considered 'healthy' to facilitate the setting of thresholds.
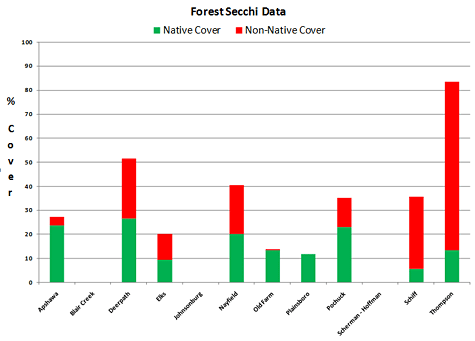
Figure 2. Forest secchi data collected through 2007. Data from ten additional sites will be added in 2008. Sites are located throughout northern New Jersey.


